Infographics are one of the most powerful, yet often overlooked, tools in an SEO professional’s kit. They're more than just pretty pictures; they're a strategic blend of compelling data and visuals that can seriously boost your search rankings. Think of an infographic as the highlight reel for your best content—it grabs complex information and makes it simple, shareable, and incredibly linkable. Those are all things that send fantastic signals to search engines like Google.
Why Infographics Are an SEO Powerhouse
In a world drowning in text, a great infographic is a breath of fresh air. It cuts straight through the clutter, turning dense data or complicated subjects into something visually engaging and easy to understand. This isn't just about aesthetics; it's a calculated move that directly impacts key SEO metrics and how people interact with your site.
Imagine a standard blog post is a detailed textbook. The infographic is its cheat sheet—delivering the core message almost instantly. That immediate hit of value is exactly what both users and search engines love to see. When someone lands on your page and gets the point right away, they're far more likely to stick around. This boosts "dwell time," a crucial signal that tells Google your page is a great answer for what the user was looking for.
Keeping Readers Engaged and On the Page
A well-designed infographic stops the scroll cold. Instead of facing a intimidating wall of text, a user can quickly pick up key stats, follow a process, or grasp a new concept. This visual journey keeps them on your page longer, which Google interprets as a sign of high-quality, relevant content. After all, a longer dwell time strongly suggests your page is doing its job and satisfying the searcher's needs. If you're curious about how search engines figure all this out, you can explore our guide on how a web crawler works.
The Viral Potential of Social Sharing
Let's face it, infographics are built to be shared. Their visual format is a perfect fit for platforms like Pinterest, LinkedIn, and X (formerly Twitter). Every time someone shares, likes, or comments, it creates a social signal. While these signals aren't a direct ranking factor themselves, they drive a ton of traffic back to your website. More traffic means more eyeballs on your content, which leads to more people discovering it and, crucially, linking back to it. That is a direct and powerful ranking factor.
An infographic is like a self-contained value bomb. It's incredibly easy for other bloggers, journalists, and website owners to grab and embed in their own content—usually with a link back to you as the source. This is how you generate high-quality, relevant backlinks without having to beg for them.
Building Real Authority and Earning Backlinks
High-quality backlinks are the lifeblood of SEO. Infographics are one of the most natural and effective ways to earn them because you're offering something genuinely useful to other creators. When you publish an infographic packed with solid data and a sharp design, you're not just creating content; you're creating an asset that other people will want to use to make their own content better.
This visual strategy has proven especially effective here in Canada. Local SEO experts have found that Canadian businesses incorporating visually-rich content see up to 3x more organic traffic than their text-only counterparts. You can check out more insights on the future of SEO in Canada on hiilite.com.
When you boil it down, the powerful connection between infographics and SEO is based on a simple, winning formula:
- You Simplify Complexity: Making tough topics easy for everyone to understand.
- You Increase Engagement: Grabbing user attention and keeping them on the page.
- You Encourage Sharing: Creating a portable piece of content that spreads across the web on its own.
- You Earn Links: Naturally building your site’s authority and credibility.
Designing Infographics for SEO Success
Great infographics don't just happen by accident. The ones that really move the needle for your SEO are the result of a careful, deliberate process that blends a great story, clean design, and a smart keyword strategy. It’s less about artistic flair and more about creating a blueprint to turn raw data into a visual asset that works for you.
This whole process starts way before you even think about picking colours or fonts. The single most important first step is tying your infographic's topic to a clear SEO goal. That means you need to know which keyword or topic cluster you're aiming to rank for. What are the burning questions your audience is asking? Is there a complicated process you can make crystal clear? Solid keyword research gives you the answers and ensures your finished infographic has a ready-made audience waiting for it.
Once you’ve got your topic nailed down, the real fun begins: finding the story in the data. An infographic isn’t just a jumble of stats; it’s a narrative. Your job is to guide the viewer from one point to the next, building up their understanding until they reach that "aha!" moment.
Building Your Infographic Blueprint
Before you fire up your design software, you need to map out the structure. Think of it like a storyboard for a short film. A logical, easy-to-follow flow is absolutely essential for keeping people engaged and making your message stick. If the layout is confusing, people will click away, which sends all the wrong signals to search engines.
This simple visual breaks down the core strategy behind a successful SEO infographic.
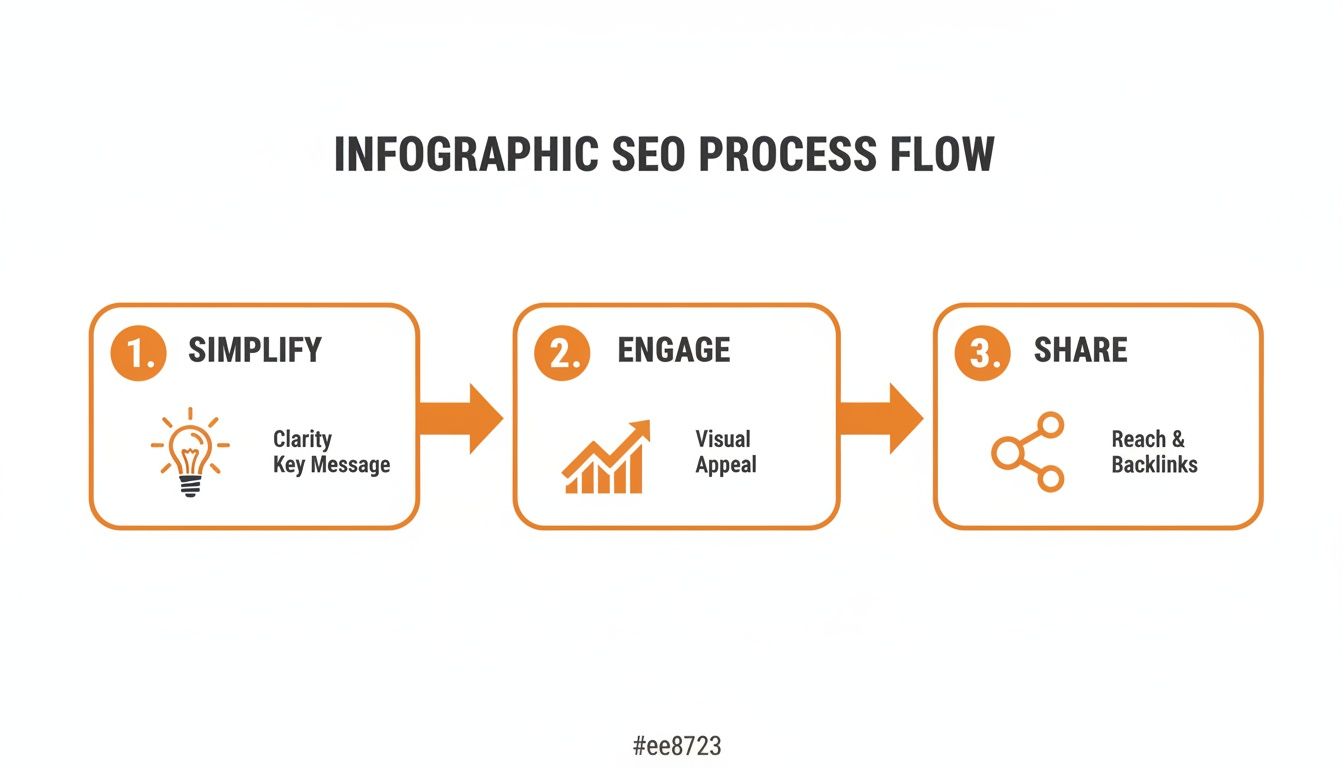
The big idea here is that effective infographics make complex topics easy to digest. This boosts engagement and makes people naturally want to share what they’ve learned.
Essential Design and Content Elements
With your story and structure in place, it's time to dig into the details that make an infographic truly shine. These elements all work together to create a piece that looks professional, feels authoritative, and gets shared.
- A Powerful Headline: Your headline is your first impression—and sometimes your only one. It has to be compelling, feature your main keyword, and promise real value to the reader.
- Brand Consistency: Stick to your company’s colours, fonts, and logo. This isn't just about looking good; it builds brand recognition and ensures that wherever your infographic goes, your brand goes with it.
- Readability and Visual Flow: Give your design room to breathe with plenty of white space. You can guide the viewer's eye with clear sections, arrows, or other visual cues. And please, use a font that's easy to read, especially since many people will be looking at it on a phone.
- Citing Your Sources: Always, always include a "Sources" section at the bottom. Backing up your claims with data from reputable sources is a huge part of building E-E-A-T (Experience, Expertise, Authoritativeness, and Trustworthiness), which is a massive factor in modern SEO.
- A Clear Call-to-Action (CTA): So, what do you want people to do next? Your CTA should point them in the right direction, whether that's to visit your site, read a deeper dive on your blog, or get in touch.
Before you even think about opening up Canva or handing a brief to a designer, running through a pre-production checklist is a non-negotiable step. It ensures your design efforts are built on a solid strategic foundation, not just guesswork.
Infographic SEO Pre-Production Checklist
| Phase | Action Item | SEO Goal |
|---|---|---|
| Strategy | Define the target audience and their pain points. | Ensure content relevancy and user engagement. |
| Keyword Research | Identify a primary keyword and 2-3 secondary keywords. | Align the infographic with search intent and ranking opportunities. |
| Content Gathering | Collect compelling data and statistics from reputable sources. | Build authoritativeness and trustworthiness (E-E-A-T). |
| Narrative | Outline the story or "flow" of the infographic from start to finish. | Improve user experience and information retention. |
| Distribution Plan | List potential outreach targets (bloggers, journalists, partners). | Prepare for link-building and promotion from day one. |
| Call-to-Action | Decide on the primary action you want the viewer to take. | Drive conversions and guide the user journey. |
This checklist forces you to think through the entire lifecycle of the infographic, from its SEO purpose to how it will be shared. It’s the difference between creating a pretty picture and a strategic asset.
By carefully planning every stage—from that initial keyword research right down to the final CTA—you can turn a simple visual into a powerful tool for infographics and SEO success. It’s all about designing with purpose, making sure every single pixel is pulling its weight for your overall strategy.
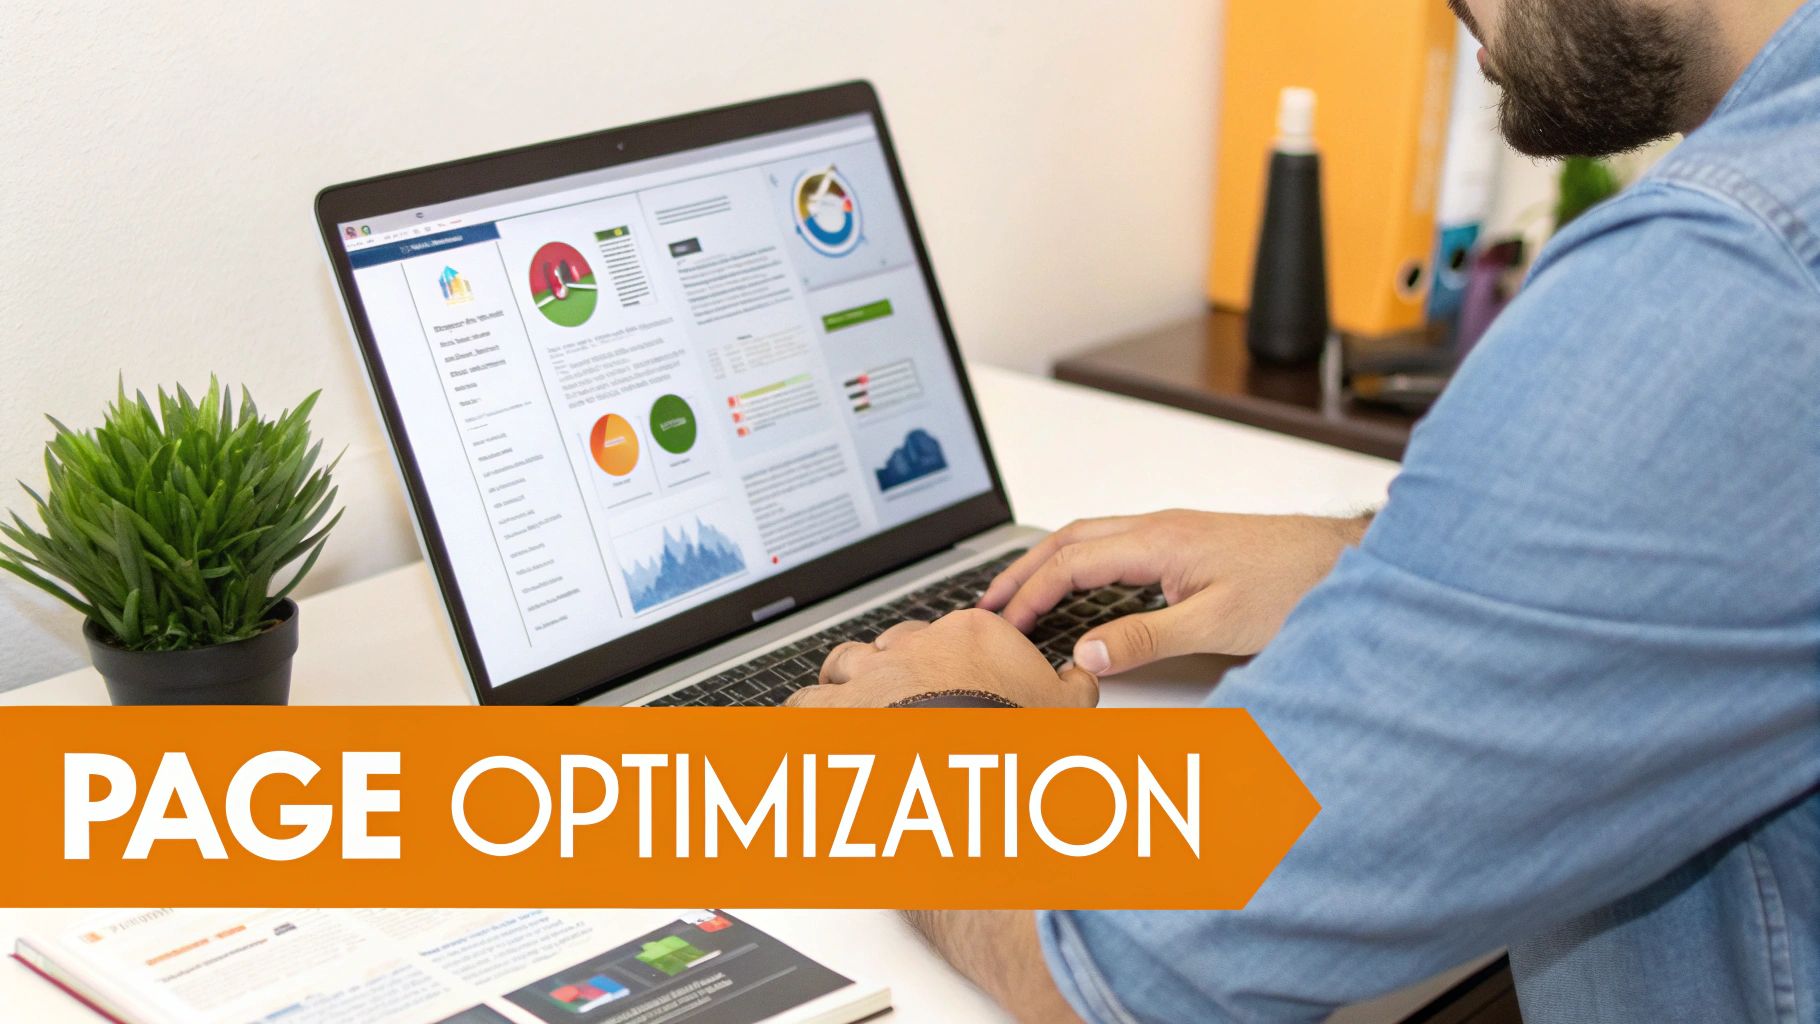
Optimizing Your Webpage for Infographics
So, you’ve created a brilliant infographic. That's a huge win, but its SEO journey is really just getting started. An infographic can't rank all by itself; it’s like a fantastic new product with no storefront. To get found by Google, it needs a fully optimized webpage to act as its home—a place that gives it context and provides the crawlable text search engines need to understand what it's all about.
Think of it this way: the infographic is the main event, and the webpage is the entire venue. You wouldn't just stick a performer in an empty room. You’d build a stage, set up proper lighting, and hand out a program. In the same way, your visual content needs to be the centrepiece of a dedicated article, not just an image dropped onto a random page.
This surrounding text and technical setup are what transform a great-looking image into a powerful SEO asset. Without this support system, even the most compelling visual will stay hidden from search engines.
Core On-Page SEO Elements
To give your infographic the spotlight it deserves, you need to treat its host page just like any other high-value piece of content. That means nailing the fundamentals of on-page SEO.
Your page title and meta description are your first impression in the search results. They need to be interesting enough to earn a click and should feature your primary keyword. If your infographic is about "The Benefits of Drip Coffee," a title like "Coffee Infographic" won't cut it. Go for something specific and enticing, like "10 Scientific Benefits of Drip Coffee Explained | Infographic." You can learn more about how to perfect your SEO meta tags in our detailed guide.
Next, turn your attention to the image file itself. Before you even upload it, give it a descriptive file name. Something like benefits-of-drip-coffee-infographic.png tells search engines a lot more than IMG_5839.png. And always remember to compress the image to keep your page loading quickly—a non-negotiable ranking factor.
Alt Text and Transcripts: The Keys to Accessibility
Search engines can't "see" the text inside your image. This is where alt text comes in. It’s a short, descriptive tag that does two critical jobs: it helps visually impaired users with screen readers understand your content, and it spells out for search engines exactly what the infographic shows.
Alt text is your chance to clearly tell Google what your infographic is about. Instead of just "infographic," a much better alt text would be: "An infographic detailing the health benefits of drip coffee, including improved cognitive function and reduced disease risk."
To really take it to the next level, include a full text-based transcript of the infographic on the page. This is the single best way to make every stat, keyword, and piece of data inside your visual 100% crawlable by search engines. It guarantees that all that hard work actually contributes to your SEO.
Advanced Technical Optimization
For those looking for an extra edge, there are a few more technical tricks you can use. Implementing Schema markup (specifically the ImageObject type) gives search engines highly structured data about your infographic. This helps Google understand its context better and can even lead to rich results in image searches.
This comprehensive approach is particularly effective in regulated or complex fields. For example, in industries like holistic health or cannabis, an infographic can break down complicated topics like compliant CBD dosing or the benefits of functional mushrooms. This strategy has been shown to earn 4x more backlinks from niche sites. On top of that, Statistics Canada reports that Canadian businesses using data-driven visuals see 42.9% higher click-through rates on featured snippets. You can explore additional insights on Canadian SEO trends and performance on hiilite.com.
When you combine all these on-page and technical optimizations, you create a powerful partnership where the infographic and its host page boost each other. It’s a holistic strategy that ensures your visual content doesn't just look amazing—it actively drives traffic, earns links, and builds your overall authority in search.
Building Backlinks with Your Infographic
So, you've created a brilliant infographic. It's optimized, it looks great, and it's live on your site. That's a great start, but it's really only half the job.
The real SEO magic happens when you turn that visual content into a magnet for backlinks. Think about it: high-quality links are one of the most powerful signals you can send to Google, and a genuinely useful infographic is the perfect bait. This is how your infographic evolves from a nice page on your site into an authority-building powerhouse across the web. The name of the game is getting your visual featured on other relevant, authoritative websites, each with a link pointing back to your original post.
Creating a Promotion and Distribution Plan
You can't just hit "publish" and cross your fingers. You need to actively get your infographic in front of the right eyeballs. The easiest place to start is with your own channels, especially on platforms where visuals are king.
- Pinterest: This isn't just a social network; it's a visual search engine. It's the natural habitat for an infographic. Make a dedicated board for your content and write keyword-rich descriptions to help people find it.
- LinkedIn: For B2B audiences, this is a goldmine. Share the infographic directly in a post, pull out the most compelling stats or takeaways for the caption, and position yourself as an expert.
- X (formerly Twitter): Your full infographic won't fit, but that's okay. Post a compelling snippet or a surprising statistic from it to hook people's interest and drive them back to the full version on your site.
Social sharing gets the ball rolling, but the heavy lifting for link building comes from direct outreach. This isn't about spamming everyone; it's about building strategic relationships. This approach is a cornerstone of effective digital PR agency services.
Executing Targeted Outreach Campaigns
Success here boils down to finding the right people. You're looking for bloggers, journalists, and editors who are already writing about your topic. Your infographic isn't a sales pitch; it's a resource you're offering to make their content even better for their readers.
Start by building a prospect list. Use Google search operators like "your keyword" + "blog" or "your keyword" + "resources" to uncover relevant articles and sites. A huge green flag is finding sites that have already published infographics—they're clearly receptive to the format.
Once you have your list, it's time to write a personalized email. A generic template will get deleted on sight. Keep it short, be respectful of their time, and focus entirely on the value you're offering.
Pro Tip: Your outreach should never feel like you're asking for a favour. Instead, frame it as a helpful contribution. Mention a specific article of theirs you enjoyed and explain exactly how your infographic could add value to their audience.
For example, we're seeing businesses in Toronto and Vancouver use infographics to fight back against the rise of zero-click searches. The ones that integrate strong visuals into their content clusters are earning 3.5x more backlinks. This is becoming crucial as the global SEO services market grows, with British Columbia agencies using AI-powered visuals to win over local businesses. You can dive deeper into these SEO statistics at AIOSEO.
Make Sharing Effortless with Embed Codes
Here's one of the simplest yet most powerful tactics in the playbook: make it ridiculously easy for people to share your infographic.
By providing an "embed code" right on the page below your infographic, you give other website owners a simple copy-and-paste solution. This little piece of HTML not only displays your visual on their site but, more importantly, it automatically includes a credit link pointing back to your original page. It removes all the friction and ensures you get the link attribution you deserve, turning every share into a valuable backlink.
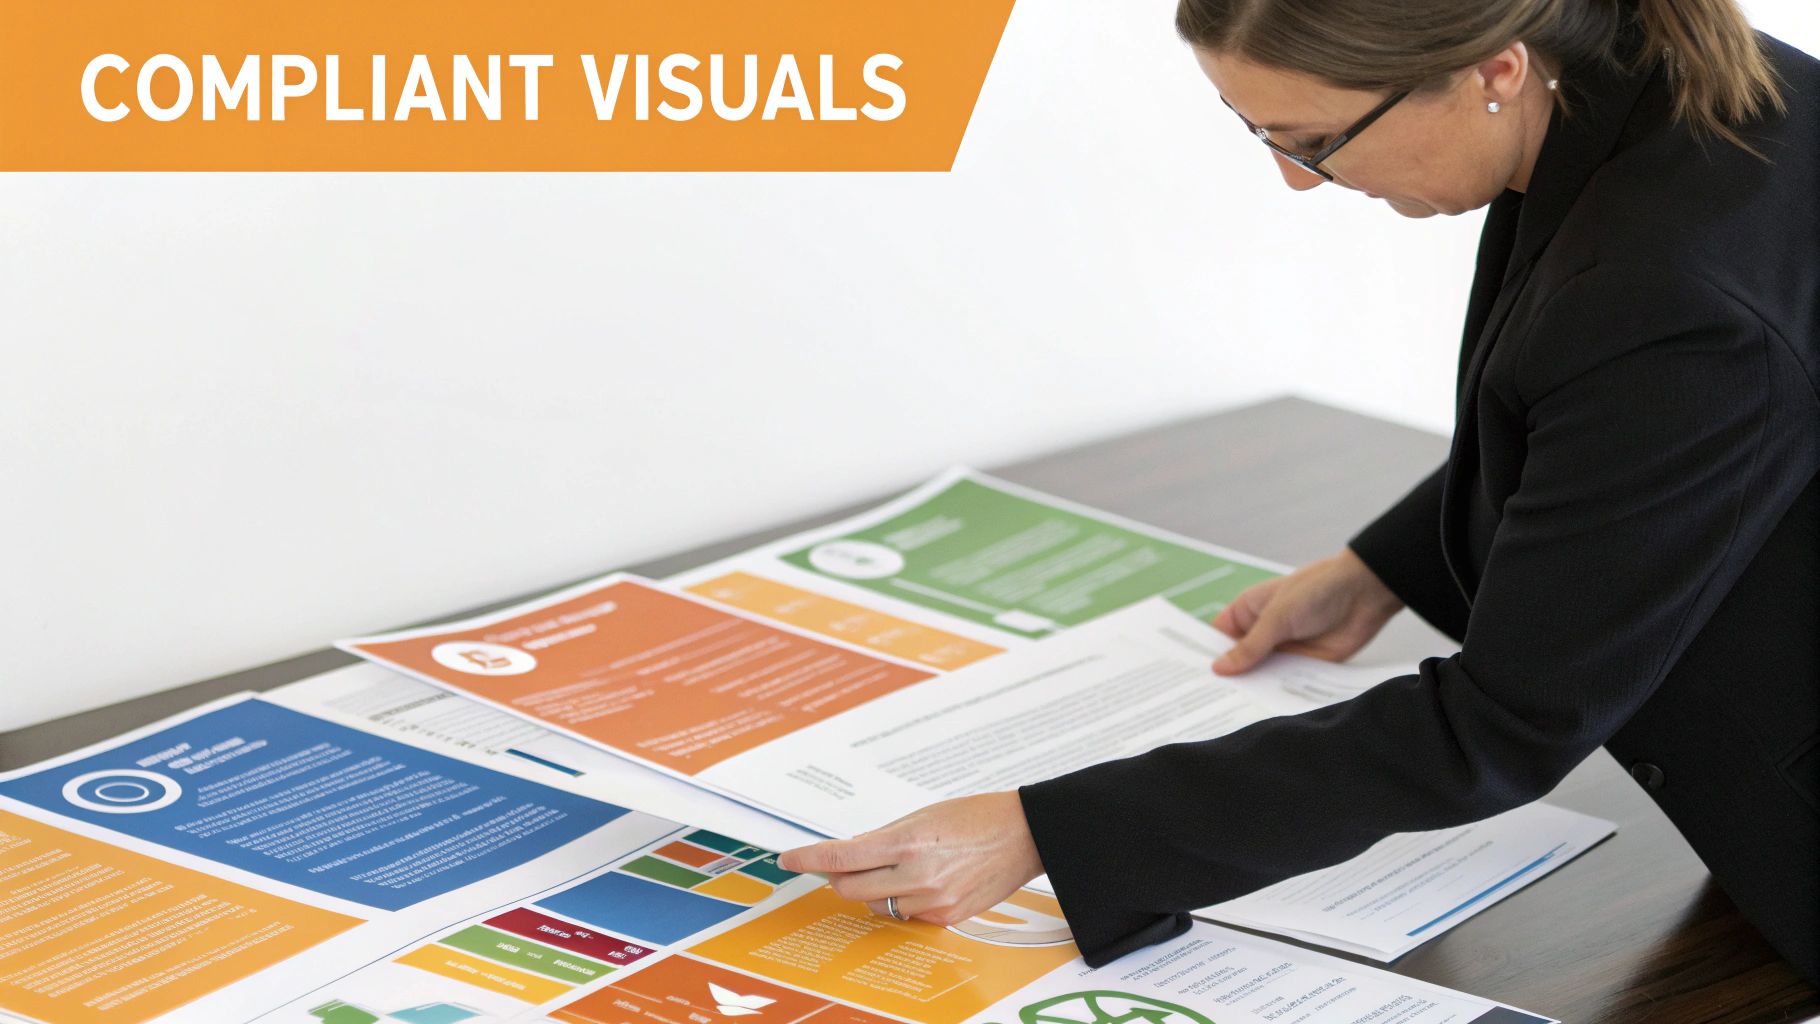
Navigating Regulated Industries with Visual Content
When you're working in a sensitive or heavily regulated field—think cannabis, CBD, or holistic health—the marketing playbook gets thrown out the window. You can't just run ads like everyone else. Making direct claims can land you in hot water with regulators. This is exactly where a smart infographic and SEO strategy becomes your secret weapon for connecting with an audience in a compliant way.
Visual content gives you a platform to educate and build trust where a hard sell is simply not an option. Instead of shouting about a product, you're informing your audience with facts and data. This isn't just about toeing the legal line; it's about positioning your brand as a credible, go-to source of knowledge in a field that's often confusing for consumers.
Focusing on Education Over Promotion
The real key to winning in these verticals is to switch your thinking from "selling" to "teaching." Your infographics need to be designed to make complex topics simple, not to make wild health claims that you can't back up. This approach builds genuine authority and helps you sidestep those tricky regulatory hurdles.
Here are a few compliant infographic ideas that work well:
- Dosage Guides: Create a visual guide that explains recommended dosages or usage based on publicly available research, all without making specific medical recommendations.
- Scientific Process Explanations: Break down a complicated process, like how CBD is extracted or the lifecycle of functional mushrooms, into a series of clear, easy-to-digest visual steps.
- Research Timelines: Map out the history of scientific studies on a specific compound or ingredient. This shows how our understanding has evolved over time.
This educational angle offers tremendous value to a curious audience and keeps your marketing efforts squarely within compliant boundaries.
Building E-E-A-T in High-Stakes Niches
Search engines have a special classification for topics dealing with health and finance: 'Your Money or Your Life' (YMYL). Content in this space is scrutinised to an incredibly high degree. Google’s E-E-A-T guidelines (Experience, Expertise, Authoritativeness, and Trustworthiness) are the gold standard here.
By presenting well-researched, clearly cited data in a professional infographic, you are directly demonstrating your expertise and trustworthiness. This sends strong positive signals to Google, helping you rank for sensitive keywords where credibility is paramount.
We’ve seen this strategy deliver real results for businesses facing these very challenges. For example, one of our CBD clients in Vancouver saw a sustained 40% growth in organic traffic after launching several infographic campaigns. We also noticed that pages with these educational visuals had double the average dwell time, which directly helped drive a 25% increase in bookings for their partner holistic health clinics. You can dig into more stats on how visual content impacts SEO on aioseo.com.
At the end of the day, for businesses in regulated industries, infographics are much more than a simple marketing tool. They are a strategic asset for building a brand that can withstand scrutiny. They let you own the conversation, educate your market responsibly, and build the kind of deep trust that fuels long-term SEO success and customer loyalty.
Here is the rewritten section, crafted to sound human-written and natural.
Measuring the SEO Impact of Your Infographics
So, you’ve created a brilliant infographic. That’s a huge win, but the work isn’t over. Now comes the real question: how do you prove it’s actually moving the needle? To show the value of your visual content, you need to look beyond vanity metrics like social shares. The true measure of success is the direct impact on your SEO performance and, ultimately, your business's bottom line.
Having a clear way to measure this connects your creative efforts to tangible results. It’s the difference between saying, "Hey, people seemed to like our infographic," and proving, "This infographic drove a 20% increase in organic leads." This data-first approach is crucial for justifying the investment in content marketing and making your next campaign even better.
Key Performance Indicators to Track
Your two best friends for this job will be Google Analytics and Google Search Console. They give you the hard data you need to see exactly how your infographic is performing in the wild.
Here are the critical KPIs you should be watching:
- Organic Traffic Growth: Is the page hosting your infographic getting more visitors from search engines? You want to see a steady, sustained climb after you’ve published and started promoting it.
- Keyword Ranking Improvements: Hop into Search Console and check your rankings for the target keywords you optimised the page for. Are you climbing the ladder in the search results?
- Backlinks Acquired: This is a big one. Use a tool like Ahrefs or SEMrush to see who is linking to your infographic's URL. Every new, high-quality backlink is a direct measure of its success.
Connecting SEO Metrics to Business Results
The final, and most important, step is to connect all these SEO wins to actual business growth. This is where you calculate the real return on your infographics and SEO strategy.
The ultimate goal is to trace a clear line from a user discovering your infographic to them becoming a customer. This proves its direct contribution to revenue and elevates its role from simple content to a powerful business asset.
We've seen this happen time and again. For instance, a wellness clinic in Vancouver we worked with jumped from page three to the top three search results for "Vancouver holistic health" after launching an infographic campaign. That move directly translated into 35% more bookings. It’s a perfect example of how a well-executed visual strategy can help you own a local market.
With AI-powered summaries becoming more common in search, pairing a human-crafted infographic with smart SEO is the key to maintaining visibility and getting a great return—a vital approach in Canada's competitive markets. You can learn more about future-proofing your SEO in Canada on hiilite.com.
To make this connection concrete, set up goal tracking in Google Analytics. Keep an eye on how many people who land on your infographic page then go on to fill out a contact form, sign up for your newsletter, or buy something. By tracking these conversions, you can put a real dollar value on your infographic's performance.
Got Questions? We’ve Got Answers on Infographics and SEO
Even with the best plan, some practical questions always pop up when you're trying to make infographics and SEO play nicely together. Let's tackle a few of the most common ones I hear from clients, so you can fine-tune your approach and get the results you're after.
How Long Should an Infographic Be for SEO?
Forget about a magic pixel count. The real question is: does it tell a complete, compelling story without any fluff? The best infographics are meaty enough to be truly useful but clear enough for someone to grasp the key points in just a few seconds.
Think vertically. A tall, skinny layout is perfect for how we scroll on our phones and it’s a natural fit for platforms like Pinterest. Your goal is to deliver a clear narrative supported by solid data, not just to hit a specific size.
Can Google Actually Read the Text in My Infographic?
Google's image-reading tech is getting smarter all the time, but you should never bet your SEO on it. It’s a huge mistake to assume that search engines can see and index the text baked into your image file.
The foolproof way to handle this is to include a full transcript or a detailed summary of the infographic's content right there on the page. This ensures every last keyword and data point is 100% visible to search engines and, just as importantly, makes your content accessible to everyone.
Should I Use an Online Tool or Hire a Designer?
This really boils down to your budget and your goals for the piece.
Online tools like Canva are brilliant for whipping up simple, good-looking infographics without breaking the bank. They're perfect for smaller projects or if you need to create visual content on a regular basis.
But if you're creating a major "hero" asset for a big link-building push, hiring a professional designer is usually money well spent. A pro can create something truly unique that captures your brand's authority and has a much better shot at cutting through the noise and getting noticed.
Realistically, How Many Backlinks Can One Infographic Get?
That's the million-dollar question, isn't it? The answer can be anything from zero to dozens. It all hinges on the quality of your infographic, how interesting the topic is, and how well you promote it.
A genuinely exceptional infographic—one that presents fascinating new data or solves a common problem—paired with a smart outreach strategy can easily earn dozens of high-quality links. On the flip side, a mediocre visual with zero promotion will probably get you nothing. Success isn't about luck; it's about creating something people genuinely want to share and then making sure they see it.
Ready to turn your complex data into a powerful SEO asset? The team at Juiced Digital designs data-driven infographic campaigns that build authority and drive measurable growth. Book your free strategy session with us today!
