You've just acquired two customers at the same checkout value. One places a second order soon, responds to a useful product recommendation, and stays with your business for years. The other never returns, requests a costly refund, and stops engaging after the first purchase. Your sales report may treat them as equal. Your profit and growth plan shouldn't.
That difference is the reason customer lifetime value, or CLV, matters. A first transaction tells you what a customer bought today. CLV helps you understand the profit a customer can generate across the full relationship, after you consider repeat purchases, retention, and the costs of serving them.
For a Canadian retailer, Vancouver service provider, or growing e-commerce brand, this changes practical decisions. It affects how much you can afford to spend on acquisition, which customers deserve a personal follow-up, whether a discount is sensible, and where retention work will have the greatest commercial effect.
Introduction Why Customer Lifetime Value Changes Every Growth Decision
A founder can look at a busy sales dashboard and still feel that growth is strangely unprofitable. Paid campaigns bring in orders, revenue rises, and the team celebrates the new-customer count. Yet cash gets tighter because each sale requires advertising, fulfilment, support, payment processing, and sometimes a return.
Now compare two customers who each spend the same amount on their first order. Customer A buys once, returns part of the order, and never responds to another message. Customer B has a smooth delivery experience, buys again when inventory runs low, adds a complementary product, and refers a colleague. The checkout value is identical, but the business relationship is not.
Customer lifetime value puts the whole relationship on the same page. BDC defines it as the amount of profit a business can expect from a customer over the full relationship, rather than the value of a single sale. Its Canadian guidance also recommends using CLV as a planning metric alongside customer acquisition cost, or CAC, with an LTV:CAC relationship of 2.5 to 3 times as a practical benchmark for healthier unit economics (BDC's customer lifetime value definition).
Practical rule: Revenue tells you what happened at checkout. CLV helps you decide what the relationship is worth and what you can responsibly invest to grow it.
This guide builds the idea from the ground up. You'll learn what customer lifetime value includes, how to choose between historical, predictive, and cohort calculations, and how Canadian formulas translate into business decisions. You'll also see why returns and channel switching matter, especially when customers research online, buy in-store, and contact support through another channel.
The useful question isn't, “What's our CLV?” It's, “Which customer relationships create durable profit, and what should we change to create more of them?”
What Customer Lifetime Value Really Means for Your Business
Start with the simplest idea: customer lifetime value is the total profit a customer creates during the relationship with your business. That relationship might last through several purchases, a recurring service arrangement, or a sequence of renewals. The exact model depends on what you sell and how your customers buy.
Customer lifetime value is the amount of profit a business can expect from a customer over the full relationship, including the effect of repeat transactions and retention.
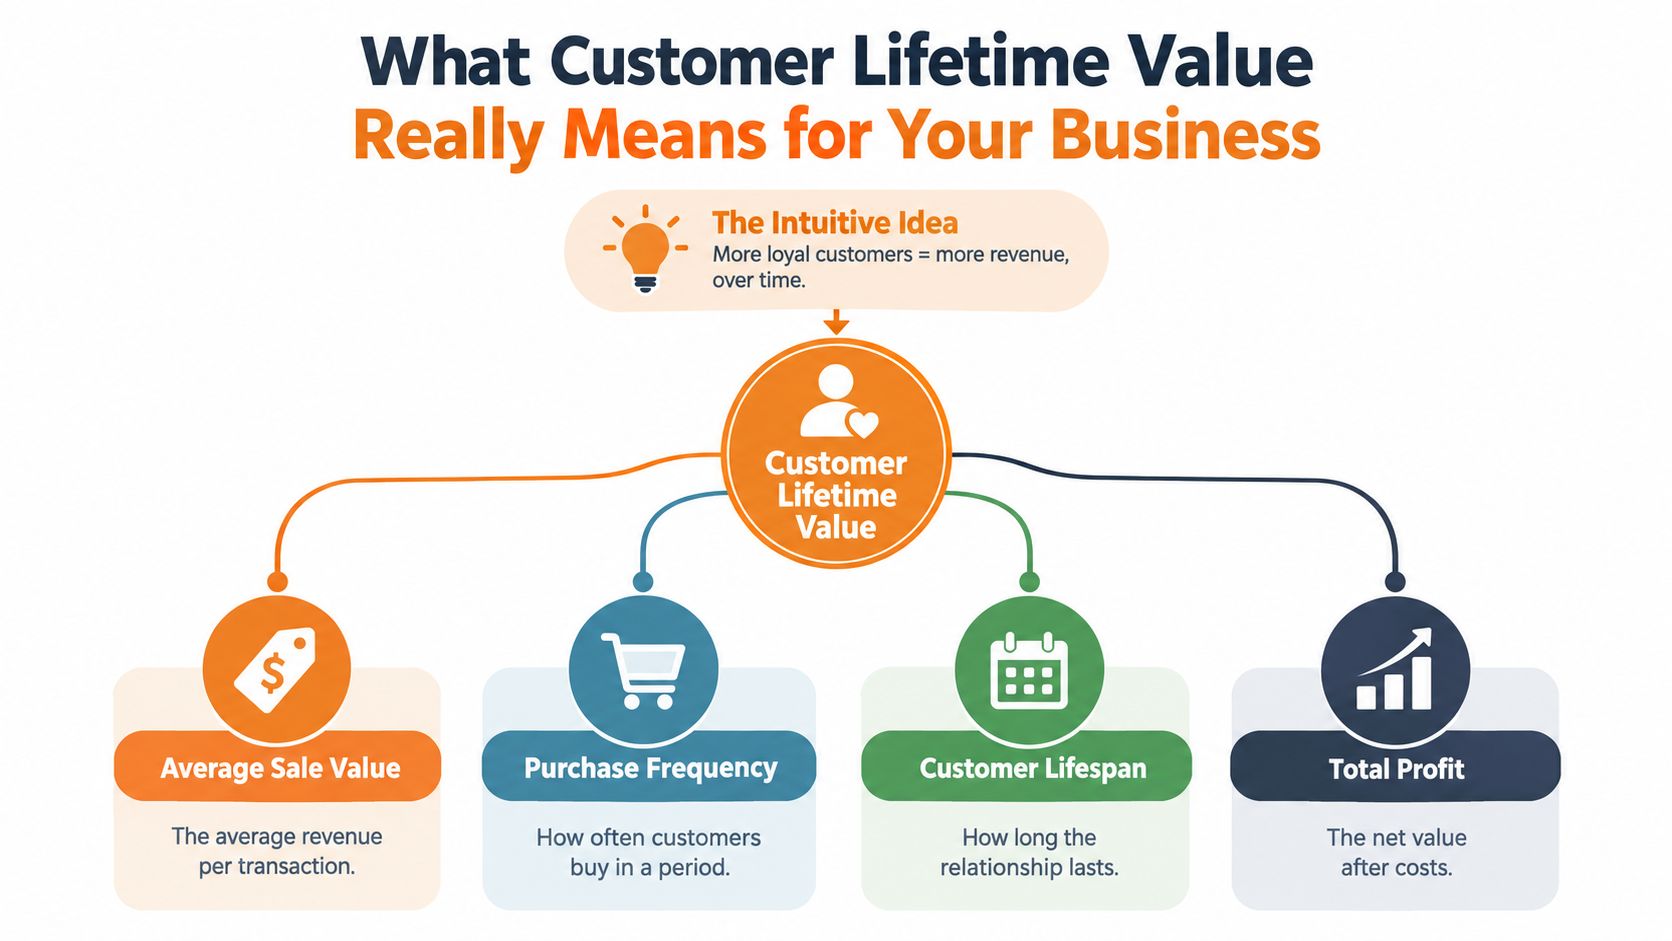
A practical CLV model has four connected parts:
- Average sale value tells you how much a typical transaction contributes before you account for the wider relationship.
- Purchase frequency shows how often customers buy during a defined period.
- Customer lifespan measures how long the relationship tends to continue.
- Profit or contribution margin removes relevant costs, so the result reflects commercial value rather than top-line revenue.
BDC presents a Canadian calculation using average sale value × average number of repeat transactions × average retention period (BDC's CLV and CAC guidance). Shopify Canada describes a closely related formula, average order value × purchase frequency × average customer lifespan, which makes the metric easier to connect to the numbers already found in an e-commerce dashboard (Shopify Canada's CLV formula).
These terms can sound similar, so separate them carefully. Average order value describes one transaction. Revenue per customer describes money collected from a customer during a chosen period. CLV looks across the relationship and, in a profit-focused model, accounts for the costs required to acquire and serve that customer.
For example, a local clinic might have a modest first booking but a strong relationship if the client returns for follow-up services. An online retailer might increase CLV by making replenishment easy. A subscription business might depend on renewals and expansion. In each case, the number rises when customers buy more often, stay longer, spend more per transaction, or cost less to serve.
Teams working with larger datasets can connect CLV analysis to predictive analytics for marketing, but the foundation stays the same. You're measuring the economic value of a relationship, not assigning a vague score to customer enthusiasm.
How to Calculate Customer Lifetime Value With Three Proven Methods
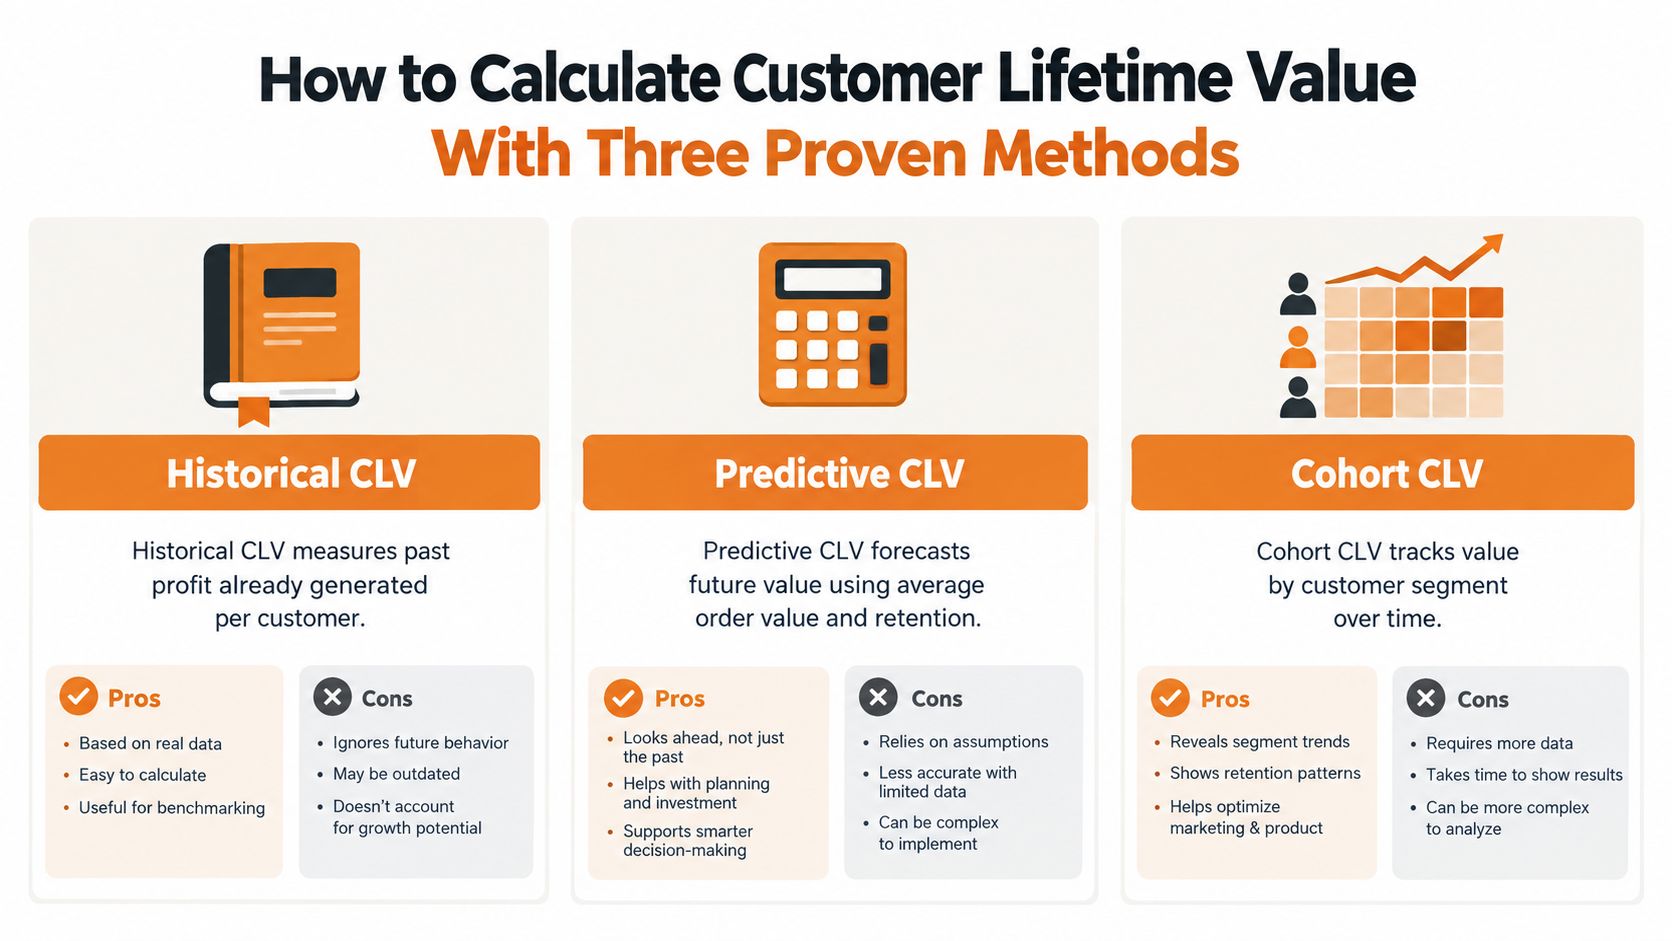
CLV is a unit-economics decision tool, so the calculation should match the decision you need to make. Historical CLV records completed value. Predictive CLV estimates what customers may generate next. Cohort CLV shows how value changes across acquisition sources, products, or customer groups.
Historical CLV
Historical CLV uses transactions that have already occurred. Add the relevant revenue or profit from customers during a defined period, then examine the value generated by that customer group.
This method works well when transaction records are dependable but the business lacks enough behavioural data for forecasting. Finance and marketing teams can understand it quickly. Its limitation is timing: past value does not show whether a recently acquired customer will repeat, churn, return products, or switch between channels.
Predictive CLV
Predictive CLV estimates future value from observed behaviour. Depending on the business model, it can include order value, purchase frequency, retention, contribution margin, service costs, returns, and the timing or risk of future cash flows.
That makes it useful for setting an allowable CAC, prioritising retention work, and planning campaigns. The number should also be read beside the CAC ratio. A customer may have a high revenue-based CLV but produce weak economics after acquisition, fulfilment, support, or returns. Forecasts are decision aids, not guarantees, especially when retention data is incomplete or buying behaviour is changing.
Cohort CLV
Cohort CLV groups customers by a shared starting point or characteristic and follows their value over time. You could compare organic-search customers with paid-media customers, or examine groups by product category, location, or acquisition period.
Cohorts expose differences that one blended average hides. A paid channel may produce strong first orders but limited repeat behaviour. Customers who begin in one channel may later purchase through email, direct traffic, or a physical location. Assigning value only to the final touchpoint can therefore distort the economics of the relationship.
Cohort definitions must stay consistent, and the groups need enough observations for a useful comparison. Returns, cancellations, discounts, and service costs should be handled in the same way across cohorts.
| Method | Core Inputs | Best For | Limitation |
|---|---|---|---|
| Historical | Past revenue or profit and customer records | Understanding completed performance | Doesn't forecast future behaviour |
| Predictive | Order value, frequency, lifespan, retention, and cost assumptions | Acquisition and retention decisions | Depends on data quality and model assumptions |
| Cohort | Customer groups, time periods, revenue, repeat behaviour, and retention | Comparing channels, products, and segments | Requires consistent tracking over time |
Historical CLV is a sensible starting point for a young business. Predictive CLV becomes more useful as retention and cost data improve. Cohort CLV is the clearest choice when you need to understand which sources and customer groups produce lasting value, rather than accepting one blended average.
Use the method that matches the question. Historical CLV explains what happened, predictive CLV supports the next investment, and cohort CLV shows where lasting value is coming from.
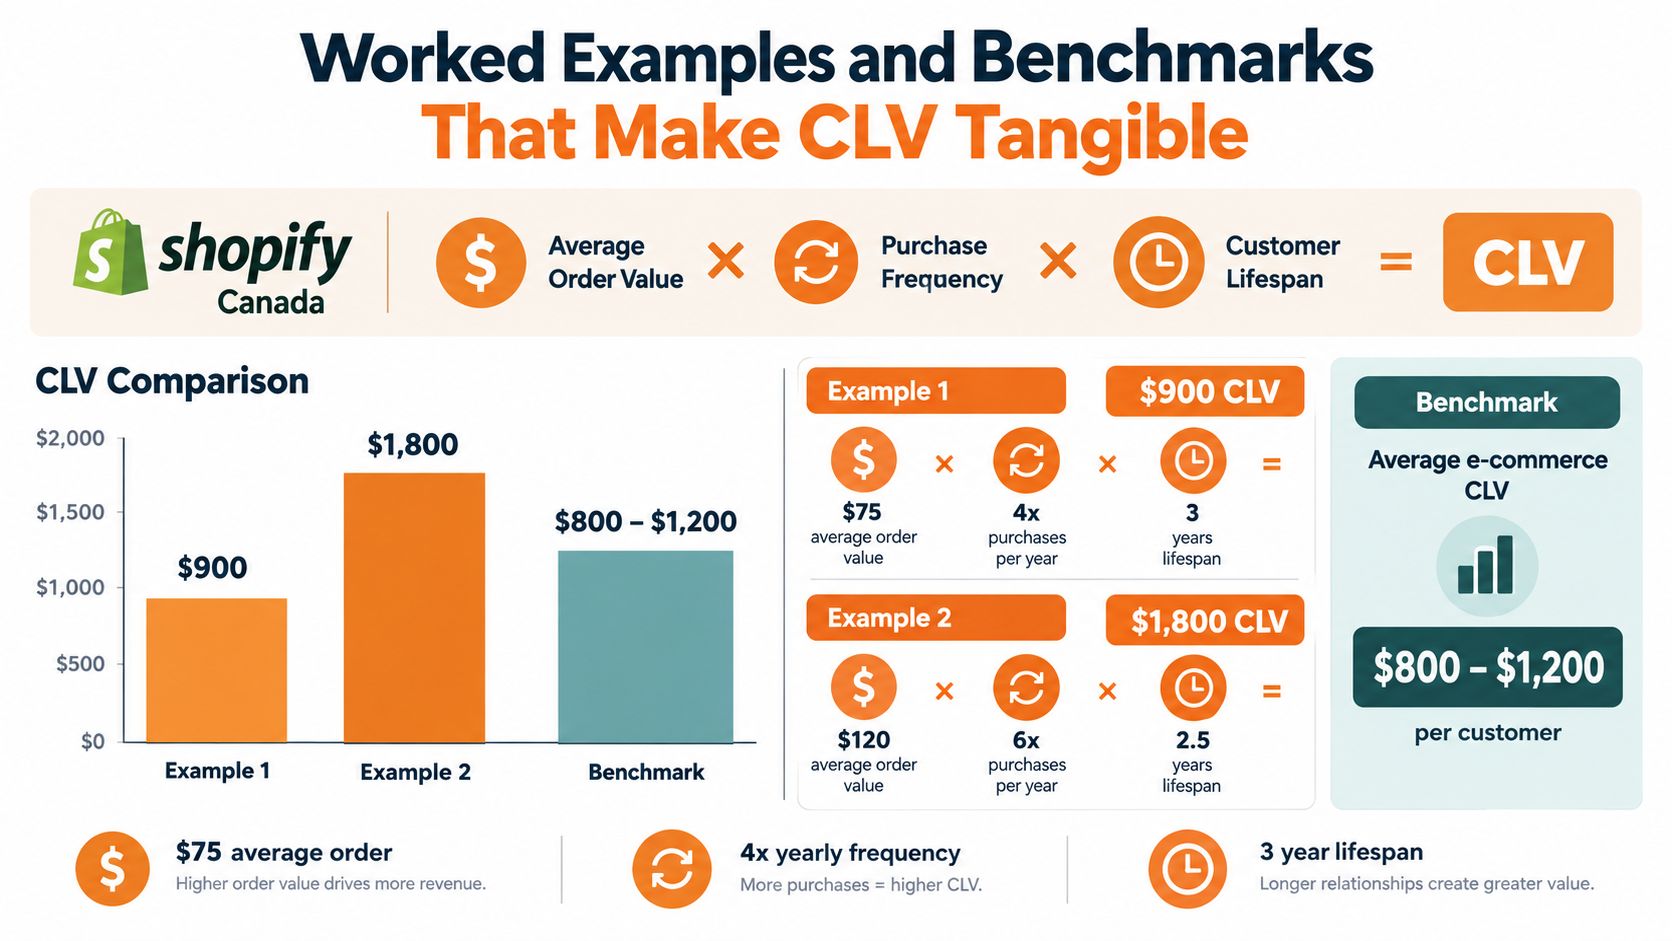
Worked Examples and Benchmarks That Make CLV Tangible
A customer who places one large order may look valuable at first. A customer who returns across several channels can be worth more, even if each purchase is smaller. CLV becomes useful when it connects that pattern to a decision about acquisition, retention, or margin.
Shopify Canada's model uses average order value × purchase frequency × customer lifespan. Suppose a business has an average order value of $100, customers buy twice during the relationship period, and the average relationship lasts three years:
$100 × 2 × 3 = $600 in revenue-based CLV
That figure represents revenue, not profit. Product costs, fulfilment, returns, service, and acquisition costs must be included for a net or contribution-based view.
BDC's version applies the same logic through average sale value, repeat transactions, and the retention period. If a service business earns an average sale of $250 and receives four repeat transactions, the calculation begins here:
$250 × 4 = $1,000 before applying the retention-period interpretation
Set the time unit before doing the multiplication. Annual purchase frequency requires a lifespan measured in years. Monthly transactions require a monthly lifespan. This consistency prevents a plausible-looking formula from producing the wrong answer.
Channel switching can change the result. A customer may first buy through a paid social ad, return through email, and later purchase in a store. Count the relationship across those touchpoints rather than assigning every later order to the original channel. Returns also reduce realized value, while retention increases it.
A Canadian CLV calculator example reports $1,219 CAD with an average customer lifespan of 25.0 months, showing how repeat purchasing and retention shape lifetime revenue (the Canadian CLV calculator example). Treat this as an example, not a universal Canadian benchmark.
Reading the CAC benchmark
BDC recommends an LTV:CAC relationship of 2.5:1 to 3:1 for decision-making (BDC's LTV:CAC benchmark). In practical terms, acquisition cost should remain comfortably below lifetime value.
If a customer produces $100 over the relationship, an acquisition cost below about $40 keeps CAC under approximately 40% of lifetime value. The lower end leaves less room for refunds, support, margin pressure, and forecasting error. Use the ratio as a guardrail, then review CLV by channel, cohort, product, geography, and customer type before raising spend.
Using Customer Lifetime Value to Guide Acquisition and Retention Strategy
CLV becomes valuable when it changes what your team does. A campaign that brings in cheap first purchases may not deserve more budget if those customers rarely return. A channel with higher initial CAC may be worth funding when it attracts customers who remain longer, purchase more frequently, and require less support.
The LTV:CAC relationship provides a common language for that trade-off. BDC's 2.5:1 to 3:1 benchmark offers a practical health check, but your team should calculate the ratio by channel and cohort rather than applying one company-wide average. The customer acquisition cost framework can help teams keep the acquisition side of that equation visible.
Spend according to relationship quality
Segment customers by more than first-order value. Useful groups might include:
- High current value: Customers who already generate strong profit and repeat reliably.
- High potential: Customers with modest initial spend but signals such as repeat browsing, product adoption, or a second purchase.
- At risk: Customers whose purchase frequency, engagement, or service interactions indicate weakening value.
- Low-fit: Customers who cost more to acquire or support than their likely relationship value justifies.
Each segment needs a different response. High-value customers may warrant personalized recommendations and proactive service. High-potential customers may need education, onboarding, or a carefully timed cross-sell. At-risk customers need diagnosis before discounting. Low-fit segments may require tighter targeting or lower-cost service models.
Model the journey customers actually take
Canadian shoppers don't always follow a clean online path. KPMG Canada reports that 66% of respondents prefer the in-store shopping experience, which reinforces the need to connect physical and digital behaviour when measuring value (KPMG Canada's omnichannel commerce insight).
A customer may discover a product through search, visit a store, purchase there, return through a courier, and later reorder online. If your analytics assigns each event to separate customers or channels, the business may understate retention and overstate acquisition costs. Returns create another distortion. A customer with strong gross revenue but frequent returns may contribute less margin than the headline CLV suggests.
Decision test: Before increasing acquisition spend, ask whether your CLV model includes repeat purchases, returns, support costs, and purchases that begin in one channel and finish in another.
Retention investment should also reflect payback timing. A business that spends heavily to acquire customers but waits too long for repeat profit can face cash-flow pressure even when the long-term CLV looks promising. Track the path from first order to contribution, then decide whether the right move is better targeting, faster second purchases, improved onboarding, or a lower acquisition cost.
Proven Ways to Increase Customer Lifetime Value Across Industries
Growing CLV usually means improving the customer experience around the transaction, not pushing more promotions. The strongest levers make it easier for the right customers to buy again, stay longer, or choose a more suitable offer.
Improve relevance through segmentation
Group customers by behaviour and need. An e-commerce brand can separate first-time buyers from replenishment customers, high-return customers, and shoppers who purchase complementary categories. A Vancouver clinic can distinguish new inquiries, completed first appointments, recurring clients, and people who haven't booked again.
Personalization should answer a real customer need. Recommend the next useful product, explain how to get more value from a service, or remind a client when a follow-up is appropriate. Generic discounts may create an order without building a relationship.
Increase value per transaction carefully
Bundles can reduce decision friction when the products naturally belong together. A wellness retailer might pair a core product with an accessory or educational service, while a local service provider might package an initial consultation with a relevant follow-up.
Pricing changes need margin discipline. Compare the contribution of the bundle with the separate items, and watch returns closely. A higher order value doesn't help if the offer attracts customers who are expensive to serve or disappointed by what they receive.
Build the second purchase into the first experience
The post-purchase period is often where future CLV is won or lost. Set clear delivery expectations, provide useful product guidance, and make support easy to access. A replenishment reminder should reflect likely usage, not arrive immediately after checkout without context.
Use customer retention strategies to organise follow-up around customer milestones. For a local business, that may mean a timely rebooking prompt. For e-commerce, it could involve care instructions, product education, or a relevant recommendation after the customer has had time to use the original purchase.
Match the tactic to the industry
- E-commerce brands: Test product-page clarity, checkout friction, bundles, replenishment messages, and return communication. Track repeat revenue after each experience change.
- Local service businesses in Vancouver and British Columbia: Make booking simple, confirm expectations, follow up after delivery, and create a clear next step for ongoing care.
- Cannabis, CBD, functional mushroom, and health brands: Keep claims and promotional language compliant with applicable rules. Use education, transparency, and trust-building rather than unsupported health promises.
- Clinics and wellness practitioners: Connect inquiries, bookings, attendance, follow-ups, and rebooking behaviour so the team can distinguish lead volume from durable client value.
Conversion rate optimization helps more of the right traffic become customers, while lifecycle marketing helps those customers continue the relationship. Treat both as parts of the same CLV system.
How Juiced Digital Helps You Measure and Operationalize CLV
A spreadsheet can calculate customer lifetime value once. An operating system keeps the metric useful as products, channels, and customer behaviour change.
Begin with clean definitions. Decide whether your primary measure is revenue, contribution, or profit. Document how you treat refunds, returns, shipping, support, discounts, and acquisition costs. Then connect the relevant data from your e-commerce platform, CRM, advertising accounts, analytics tools, booking system, and customer service records.
A practical dashboard should let you view CLV by:
- Customer segment: Compare first-time, repeat, high-potential, and at-risk groups.
- Acquisition channel: Identify whether organic search, paid media, referrals, or offline activity creates lasting value.
- Cohort: Follow customers acquired during the same period or through the same campaign.
- Product or service: See which offers lead to repeat transactions and which create costly returns.
- Journey stage: Monitor the movement from first purchase to second purchase, retention, expansion, or churn.
The dashboard shouldn't stop at a single average. Add CAC, contribution margin, return activity, repeat-purchase rate, and retention period so the team can understand why CLV changes. For omnichannel businesses, reconcile customer identities across online and offline interactions where privacy-compliant data practices allow it.
Juiced Digital can support this work through AI-driven SEO, paid advertising, conversion rate optimization, digital PR, local search, and compliant marketing for regulated sectors. The practical connection is straightforward: acquisition reporting should show not only which campaigns generate traffic or leads, but whether they bring customers whose relationships create durable value.
Use the metric in weekly or monthly decisions. Review which cohorts deserve more investment, which onboarding steps need improvement, and where returns or service friction reduce contribution. CLV becomes meaningful when a campaign manager, sales lead, customer service team, and owner can all use the same definitions to choose their next action.
Juiced Digital can audit your acquisition and retention data, build a clearer CLV view by channel and cohort, and connect the findings to SEO, paid media, and CRO decisions. Visit Juiced Digital to request a consultation and turn customer lifetime value into a practical growth plan.