
Figuring out your Total Addressable Market (TAM) really comes down to two main ways of thinking: the top-down approach and the bottom-up approach. You can either start with the entire market and whittle it down to what’s relevant for you, or you can build it up piece by piece from your ideal customer segments.
Either way, the goal is the same: to get a clear picture of the total revenue you could possibly generate if you captured 100% of the market.
What Is Total Addressable Market and Why It Matters

Before we jump into the spreadsheets and formulas, let's get a handle on what TAM really is. I like to think of it as the entire revenue pie for your business idea. It’s the absolute maximum potential if every single person who could conceivably buy your product or service actually did.
It’s the 30,000-foot view of your market, and honestly, it’s one of the most fundamental numbers any serious business needs to know.
But TAM doesn't tell the whole story on its own. To really make it useful, you have to look at it alongside two other critical metrics: SAM and SOM.
Understanding the TAM, SAM, SOM Trio
These three acronyms work in harmony to give you a layered, and much more realistic, view of your market opportunity. They help you zoom in from the massive, theoretical market to a practical, achievable target.
To make sense of the relationship between these key metrics, here’s a quick breakdown.
TAM vs SAM vs SOM: A Quick Comparison
| Metric | Definition | Example (Vancouver SEO Agency) |
|---|---|---|
| TAM (Total Addressable Market) | The total global demand for a product or service. The biggest possible pie. | The total annual amount all businesses worldwide spend on SEO services. |
| SAM (Serviceable Addressable Market) | The segment of the TAM that you can actually reach with your current business model and geography. | The total amount spent on SEO by businesses located in British Columbia, the region our agency can realistically serve. |
| SOM (Serviceable Obtainable Market) | The slice of your SAM you can realistically capture in the short term, given your competition and resources. | Aiming to capture 1% of the British Columbia market in the first year. This is the agency's initial target. |
This table shows how you move from a massive global figure down to a concrete, actionable goal for your first year or two in business.
TAM shows the potential, but SAM and SOM ground that potential in reality. Investors care about the big vision (TAM), but they invest based on your credible plan to conquer a specific segment (SOM).
The Strategic Value of a TAM Calculation
A solid TAM calculation is so much more than a vanity metric for a pitch deck. I've seen it act as a strategic compass for countless businesses, guiding everything from product development to marketing spend.
When you have a clear grasp of your market size, you can make smarter decisions. It helps you prioritise which features to build, where to allocate your marketing budget, and how to define your entire go-to-market strategy. It stops you from wasting time and money chasing a market that’s just too small.
Ultimately, knowing your TAM ensures you’re not just building a great product, but building it for a market that can actually sustain growth. It validates your vision and confirms your long-term business goals are achievable. As you start exploring the various objectives of marketing, you'll see that a well-defined market size is the bedrock of nearly every successful campaign.
The Top-Down Approach: Seeing Your Market from 30,000 Feet
Think of the top-down approach as the satellite view of your market. You start with a huge, established number—like the total spending in an entire industry—and then methodically zoom in, slicing away the parts that don’t fit your specific business.
This is often the fastest way to get a ballpark figure for your market size. It's built on existing high-level research from credible sources, which means you don't have to spend weeks counting individual customers from the ground up.
Starting with the Big Picture
First things first, you need to find a reliable, macro-level number. Ask yourself: what's the largest possible universe my product or service could live in? At this stage, you're not aiming for precision; you're looking for the total economic activity in a whole sector.
Good places to start digging are:
- Industry Reports: Firms like Gartner, Forrester, or IBISWorld live and breathe this stuff, publishing massive market analyses.
- Government Statistics: Agencies like Statistics Canada are a goldmine of data on economic activity across countless sectors.
- Financial Filings: Public companies in your space often drop market size estimates in their annual reports or investor presentations.
The goal here is to anchor your entire calculation to a number that is widely accepted and easy to defend. This figure becomes the foundation for your whole top-down analysis.
The top-down approach is really an exercise in logic and segmentation. You're not just pulling numbers out of thin air. You're applying a series of smart, logical filters to a large, validated figure to find the market segment that actually matters to you.
Applying Filters to Bring It into Focus
Once you have that big number, the real work begins. You'll apply a series of filters to shave off the irrelevant chunks of the market. These filters have to be directly tied to your business model, where you operate, and who you're actually trying to sell to.
Let's say a new wellness clinic in British Columbia wants to map out its TAM. Here’s how they could approach it:
- Start Broad: They'd begin with the total annual healthcare spending across Canada.
- Filter by Category: Then, they’d narrow it down to the percentage of that spending dedicated to alternative and complementary medicine.
- Filter by Geography: Next, they would isolate the spending that happens specifically within British Columbia.
- Filter by Service Area: Finally, they'd zero in on the Metro Vancouver region, which is their actual service area.
With each step, that massive national statistic gets whittled down into something that looks like a real, tangible market for that one clinic. It's a process that turns a vague, abstract number into a powerful business insight.
A Real-World Scenario in Action
Here’s a practical example I've seen play out. A software company identified 30,000 potential businesses in North America that could use their product. Based on their pricing, they figured the average annual account value was about $5,000. A quick multiplication gave them a top-down TAM of $150 million.
That’s a classic top-down calculation. It starts with a broad customer count and applies an average revenue number. For Canadian businesses, resources from Statistics Canada and provincial databases are invaluable for finding these credible baselines. For instance, data from the Monthly Wholesale Trade Survey can provide authoritative stats on market size, giving your analysis a solid, defensible foundation.
Pros and Cons of the Top-Down Method
Like any tool, this approach isn't perfect for every job. Knowing its strengths and weaknesses helps you decide when to use it and how to frame your results.
| Pros | Cons |
|---|---|
| Fast and Efficient You're standing on the shoulders of giants by using existing research, making it a quick way to get an initial estimate. | Can Be Imprecise It hinges on assumptions. If your filters aren't carefully validated, you can easily overestimate the market. |
| Good for New Markets Incredibly useful when you're entering a new space and have zero customer data to build from the bottom up. | Lacks Granularity It doesn't tell you much about specific customer segments or what makes them buy. |
| Provides a "Big Picture" View It's a fantastic way to show investors the sheer scale and long-term potential of the opportunity. | May Be Less Defensible Get ready for pushback from sharp investors if your filters and assumptions feel arbitrary or aren't well-justified. |
At the end of the day, the top-down method is an excellent way to quickly sketch the outer boundaries of a market. It’s most powerful when you use it to establish a high-level ceiling for your potential, which you can—and should—later refine with a more detailed, bottom-up analysis.
The Bottom-Up Approach: Building Your TAM From the Ground Up
While the top-down method gives you a panoramic view of the market, the bottom-up approach is where the real work happens. This is how you build a market size calculation that’s not just big, but believable. Instead of starting with a massive industry number and whittling it down, you begin with a single potential customer and build your market from there.
Think of it as counting every single brick to figure out the size of the house. It's granular, specific, and far more defensible because it’s rooted in tangible data about your real-world customers, not just broad, sweeping industry assumptions.
Getting Specific: How to Count Your Customers
The heart of a bottom-up calculation is identifying and counting the total number of customers who perfectly fit your ideal profile. This means rolling up your sleeves and digging into data sources to find a realistic number of businesses or individuals who could actually buy your product.
This process is what transforms your TAM from a vague, theoretical number into a concrete business case. You're no longer guessing; you're counting. This is exactly why it’s become the preferred method for many Canadian B2B SaaS companies trying to validate their model for investors—it offers a level of transparency that venture capital firms love because it's built on verifiable data.
The diagram below really captures the essence of this filtering process, showing how you methodically narrow your focus from a massive industry down to a specific, countable segment.
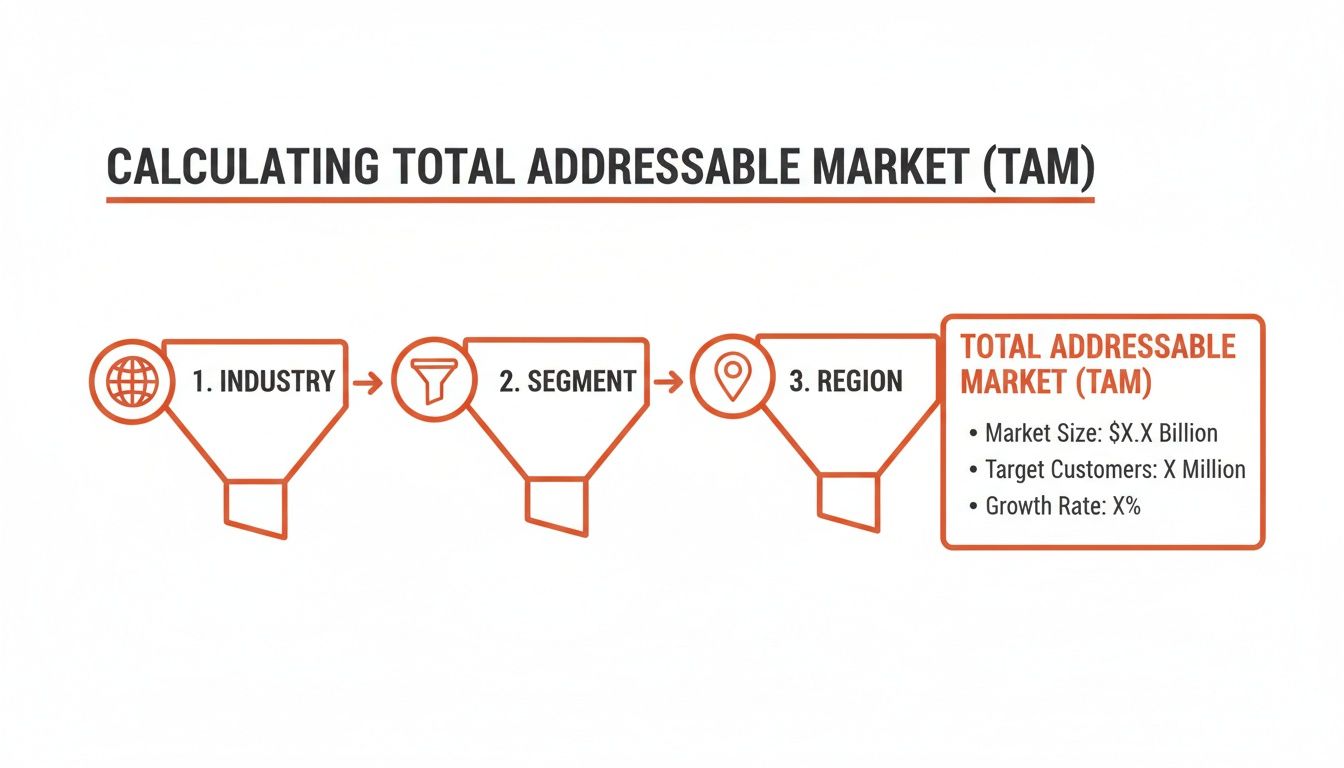
This flow is the foundational logic behind any strong bottom-up analysis. You start broad and get progressively more specific until you have a clear, defined target.
The Bottom-Up TAM Formula
The formula itself looks simple on the surface, but its power comes from the quality of the data you feed it.
Bottom-Up TAM = (Total Number of Potential Customers) x (Average Revenue Per Customer)
The real challenge isn't the multiplication; it’s finding accurate numbers for those two variables. Your customer count needs to be precise, and your average revenue—often called Average Revenue Per User (ARPU) or Annual Contract Value (ACV)—must be grounded in reality.
A Real-World Example: An AI SEO Service
Let's put this into practice with a modern business: an AI-powered SEO service designed for e-commerce brands in North America. This is where a bottom-up calculation truly proves its worth.
First, we need to count our potential customers. Our service is best for established online stores, so we need to get very specific about our ideal customer profile:
- They run their store on the Shopify platform.
- They generate over $1 million in annual revenue.
- Their business is based in Canada or the United States.
To find this number, we can turn to technology profiling tools like BuiltWith. A tool like this can tell us exactly how many websites use Shopify. From there, we can use other data points like estimated traffic or technology spend to zero in on companies that meet our revenue criteria.
After digging in, let’s say our research gives us a solid number:
- There are 35,000 Shopify stores in North America that fit our ideal customer profile.
Next, we need a realistic figure for our average revenue per customer. Based on our pricing and service packages, we might land on a conservative Annual Contract Value (ACV) of $12,000.
Now, we just have to plug these numbers into the formula:
35,000 potential customers x $12,000 ACV = $420,000,000 TAM
This $420 million figure is incredibly powerful. It’s not a wild guess based on the entire multi-trillion-dollar e-commerce industry. It’s a specific, defensible number built from a clearly defined and reachable customer segment. Of course, a key part of validating this is knowing your competition. You can learn more about sizing up your rivals in our guide on how to conduct competitive analysis.
Why This Method Wins Over Investors
A well-executed bottom-up analysis shows you’ve done your homework. It demonstrates a deep, practical understanding of your market. You're not just pulling a big number from a report; you’re showing that you know exactly who your customers are, where to find them, and what they’re worth to your business.
This level of detail is precisely what investors and stakeholders are looking for. It proves your go-to-market strategy is grounded in reality, not wishful thinking. It’s the difference between saying "the market is huge" and proving "here is our specific, multi-million dollar opportunity, and here’s exactly how we found it."
Where to Find the Data You Need
A TAM calculation is only as good as the numbers you plug into it. Whether you’re starting from the top down or building from the bottom up, you need solid, verifiable data to turn this from a back-of-the-napkin guess into a real strategic tool. The good news is, you don’t have to invent these numbers. A ton of high-quality data is out there if you know where to dig.
Sourcing the right information is what takes the theory of TAM and makes it real. This is where you put on your detective hat, piecing together clues to build a clear picture of your market opportunity.

Starting with the Big Picture: Top-Down Data
For a top-down analysis, you need to find those big, macro-level numbers that define the absolute ceiling of your market. Government agencies are almost always the best place to start. Their data is impartial, meticulously collected, and free.
For businesses operating in Canada, these are my go-to's:
- Statistics Canada: This is ground zero for any Canadian business. You’ll find incredibly detailed data on economic activity, industry performance, and demographic trends right across the country.
- SEDAR+: Think of this as a treasure trove of market intelligence. It's where all Canadian public companies file their reports, and tucked inside you can often find valuable market size estimates and industry forecasts.
- International Databases: If your sights are set globally, sources like the World Bank Open Data or the CIA World Factbook offer fantastic country-level economic and demographic stats.
These sources give you a credible, defensible starting point. You’re grounding that initial huge number in data that investors and stakeholders trust.
Nailing the Niche: Industry-Specific Reports
Government data gives you the wide-angle view, but you’ll need to zoom in on your specific niche. This is where private market research firms are invaluable. They do the expensive, time-consuming work of surveying industries and compiling incredibly detailed reports on market size, growth trends, and the competitive landscape.
Firms like Gartner, IBISWorld, and Forrester are the heavyweights here. Their full reports can cost a pretty penny, but you can often find key stats and insights quoted in industry news articles or free executive summaries they publish.
The goal isn't just to find a number; it's to understand the story behind it. A quality report won't just tell you the market is worth $10 billion, it will explain the drivers and trends shaping that market. That context is what makes your analysis truly compelling.
Getting Granular: Bottom-Up Data
When you flip to a bottom-up calculation, the game changes. You’re no longer looking at broad reports; you're hunting for specific, countable customer units. Specialized tools and niche databases become your best friends here, letting you precisely identify and count your ideal customer segments.
Let's look at some real-world examples:
- A CBD brand in Canada would need to tap into data from provincial cannabis licensing boards to get an exact count of licensed retailers—their primary channel.
- A SaaS tool for Shopify merchants could use a platform like BuiltWith or Store Leads to find out exactly how many online stores meet their criteria, like annual revenue or specific app usage.
- An SEO agency in Vancouver could use local business directories or sift through industry association member lists to build a very real list of potential clients in their service area.
This "boots on the ground" approach ensures your TAM is built on a foundation of actual, verifiable businesses or customers. The skills you develop in learning how to leverage data-driven digital marketing are the exact same ones that help you nail this kind of granular analysis.
Putting It All Together in a Spreadsheet
Once you've hunted down your data, you need a central place to make sense of it all. Honestly, a simple spreadsheet in Google Sheets or Excel is all you need to build your TAM model. Don't overcomplicate it.
For a bottom-up model, your sheet might look something like this:
- Customer Segment: Name the specific group (e.g., "Toronto-based restaurants with 10+ staff").
- Number of Customers: The total count you found for that segment.
- Average Revenue Per Customer: Your estimated annual price or contract value for this group.
- Segment TAM: A simple formula multiplying the customer count by the average revenue.
By breaking your market into different segments, you can just sum them up at the end for your total TAM. This structure is brilliant because it also lets you easily tweak your assumptions—what if you charged 10% more? what if you found a new segment?—and instantly see how it impacts the bottom line.
Essential Data Sources for Accurate TAM Calculation
Finding the right data can feel like searching for a needle in a haystack. To make it easier, here’s a quick-reference table of reliable sources I often turn to, broken down by what they’re best for.
| Data Source Type | Specific Examples | Best For |
|---|---|---|
| Government Agencies | Statistics Canada, U.S. Census Bureau, SEDAR+, The World Bank | Macro-economic data, population demographics, industry-wide revenue figures. |
| Market Research Firms | Gartner, Forrester, IBISWorld, Statista, Nielsen | Deep industry analysis, market growth trends, competitive intelligence. |
| Industry Associations | Local Chambers of Commerce, Trade-specific groups (e.g., BCTIA) | Niche market data, member directories for counting potential customers. |
| Company Filings | Public company 10-K reports, annual reports, investor presentations | Competitor market size claims, industry outlooks from market leaders. |
| Specialized Tools | BuiltWith, Store Leads, Ahrefs, business directories (e.g., Yelp) | Granular data for counting specific customer types (e.g., # of Shopify stores). |
This isn't an exhaustive list, but it's a powerful starting point. The key is to blend sources. Use a top-level government stat to set the ceiling, then use industry reports and specialized tools to zero in on the segment that's truly yours for the taking.
Common Pitfalls in TAM Calculation and How to Avoid Them
Figuring out your TAM is a fantastic exercise for clarifying your vision, but it's also surprisingly easy to mess up. A few common missteps can lead to wildly inflated numbers that will mislead your own team and make savvy investors skeptical. Let’s walk through the most common traps I’ve seen and how you can steer clear of them.
The most frequent error? Making revenue assumptions that are just way too optimistic. It's tempting to take your highest price point and multiply it by every potential customer you can think of, but that’s not how the real world works. This simplistic approach completely ignores discounts, different pricing tiers, and the fact that not all customers are created equal.
A much better, more defensible strategy is to model out your revenue based on different customer segments. If you’re a SaaS company, for example, break down your market into small businesses, mid-market companies, and enterprise clients. Each of these will have a different average contract value, and your final number will be far more grounded in reality.
Using Unreliable or Outdated Data
Another major pitfall is basing your entire analysis on flimsy data. If you’re pulling numbers from a single, unverified blog post or a market report from five years ago, you're building on a shaky foundation. Anyone who knows what they're looking at will see right through it.
Always triangulate your data. If you see a market size estimate in an industry article, hunt for a government source like Statistics Canada or a report from a respected research firm to back it up. For a bottom-up approach, get as close to the source as you can—scrape business directories or use tools that provide real, current customer counts.
The strength of your TAM calculation is only as good as the quality of your data. Vague assumptions and outdated figures are red flags for anyone scrutinizing your business plan.
Forgetting About Market Constraints
Finally, it’s a huge mistake to ignore the real-world barriers that will inevitably shrink your market. This is especially true if you’re in a regulated industry, where the rules can dramatically limit who you can sell to and where you can operate.
TAM really became a hot topic in Canadian startup circles between 2015 and 2020, and many founders turned to firms like IBISWorld to get their numbers. But for businesses in tricky spaces like cannabis or CBD, it's not that simple. You have to layer provincial regulations on top of your market data.
For example, a marketing agency in Vancouver might identify 2,500 cannabis retailers across Canada as potential clients. But if provincial advertising rules make half of them impossible to target, the real market is much smaller. A smarter approach is to segment the market—maybe into 1,200 CBD retailers and 3,000 functional mushroom companies—and then apply realistic marketing spend estimates and regulatory filters. You can see more on how Canadian companies tackle this on this Swoop Funding page.
Always challenge your own assumptions by asking what could get in the way:
- Regulatory Hurdles: Are there specific licences you or your customers need? Are there advertising bans?
- Geographical Limits: Can you really serve customers across the entire country, or are there practical limitations?
- Technological Barriers: Does your target market have the tech infrastructure to even use your product?
When you proactively account for these constraints, your TAM transforms from a theoretical fantasy number into a practical, strategic tool that shows you the real opportunity.
Frequently Asked Questions About Calculating TAM
Even with a detailed guide, you'll inevitably run into questions when you're buried in spreadsheets trying to nail down your numbers. I've put together answers to some of the most common questions that pop up during the TAM calculation process. Think of this as your go-to reference for quick clarifications and troubleshooting.
How Often Should I Recalculate My TAM?
Your Total Addressable Market isn’t a one-and-done calculation. Markets are living things—they breathe, shift, and evolve thanks to new tech, changing customer habits, and economic swings. A TAM you calculated a year ago could easily be leading you astray today.
For most businesses, getting into a rhythm of recalculating your TAM annually is a solid practice. It keeps your strategic planning grounded in the reality of your market, not last year's assumptions.
That said, some events should trigger an immediate recalculation, no matter where you are in your annual cycle:
- A Major Market Shift: Think about how generative AI is shaking up creative fields. A disruptive technology can expand or shrink a market almost overnight.
- Significant Regulatory Changes: This is a big one for anyone in regulated sectors like cannabis, CBD, or finance. A single new law can open up—or completely close off—entire customer segments.
- Entering a New Market: If you're expanding into a new country or launching a product for a totally different customer base, you need a fresh TAM for that specific segment. Don't just tack it on.
- A Disruptive Competitor Enters (or Exits): The competitive landscape has a direct effect on your realistic market share (SOM), but a major new player can also be a signal that the entire market (TAM) is growing.
Keeping your TAM current is just good business hygiene. It ensures your strategy stays agile and you aren't making critical decisions based on stale data.
Can My TAM Be Too Niche or Too Broad?
Absolutely. Finding that sweet spot is crucial, and it’s a common place to get tripped up. I see founders swing to one of two extremes all the time.
A TAM that's too broad is a classic rookie mistake. Saying your market is "all small businesses in Canada" or "the global e-commerce industry" might sound impressive, but it’s completely unactionable. Worse, it signals to investors that you haven't put in the work to define who your actual customer is. A massive, fuzzy TAM doesn't show ambition; it shows a lack of focus.
On the flip side, a TAM that's too niche can be just as damaging. If your final number shows a total market potential of just a few million dollars, it raises serious questions about the long-term potential of your business. It might not be big enough to sustain growth or attract the investment you need to scale.
The best way to nail it is to define your market not by a vague demographic, but by the specific problem you solve. This approach naturally carves out a TAM that is both substantial and defensible, whether you're a local Vancouver service provider or a global SaaS company.
What Is a Good TAM Size for a Startup?
This is the million-dollar question—or maybe the billion-dollar one, depending on who you ask. While it's true that VCs love to see TAMs in the billions, there’s no single "good" number. The context and the story behind the number are far more important.
Honestly, a $500 million TAM backed by a highly credible, data-driven plan to capture a real piece of it (your SOM) is infinitely more powerful than a flimsy claim to a $50 billion market. The logic and defensibility of your calculation are what really count.
Instead of getting hung up on a specific figure, ask yourself these questions:
- Is the market large enough to support our long-term ambitions?
- Is it growing, shrinking, or staying flat? A smaller but rapidly growing market can be incredibly attractive.
- How fragmented is the market? A huge market dominated by a couple of giants might be tougher to crack than a medium-sized one with no clear leader.
Ultimately, a "good" TAM is one that's big enough to build a truly meaningful company, yet specific enough that you can prove you have a realistic shot at winning a piece of it.
How Do I Calculate TAM for a Brand New Market?
This is one of the toughest challenges out there. When you're creating a new category, there are no industry reports to lean on. You have to get creative and build your case from adjacent data points.
The trick is to use a hybrid approach.
First, start with a top-down analysis based on substitutes. Look at what people are spending on the "old way" of doing things. Before ride-sharing apps, for instance, you could have estimated the TAM by looking at the total annual spending on taxis, black cars, and personal vehicle use for short urban trips. This gives you a baseline of existing spending that you plan to disrupt.
Next, build a bottom-up case from your early adopters. Who are the people or companies feeling the pain your product solves most acutely? Identify and quantify these initial customer segments. How many of them are there? What's a realistic price they'd be willing to pay? Multiplying those two figures gives you a concrete, near-term market size.
For example, when the first smart home devices appeared, the initial TAM could be estimated by counting households with high-speed internet and a proven history of buying consumer electronics, then multiplying that by a potential device price.
By combining these two methods, you create a much stronger, more convincing picture of the opportunity, even when direct market data doesn't exist yet. It proves you've thought critically about both the existing behaviour you're replacing and the specific customers you'll win over first.
At Juiced Digital, we know that a solid TAM calculation is the foundation of any successful growth strategy. Whether you're a local Vancouver business or a global e-commerce brand, our AI-driven approach to SEO, paid media, and conversion optimization is built on a deep understanding of your true market potential. We help you turn those big numbers into real revenue.
Ready to define your market and dominate it? Get your free consultation and audit today.
